New: AdmiTree DU Scholarship. We pay the full first-year tuition for the top 3 CUET scorers. See how to qualify DU Scholarship: free first-year tuition. See how
Back
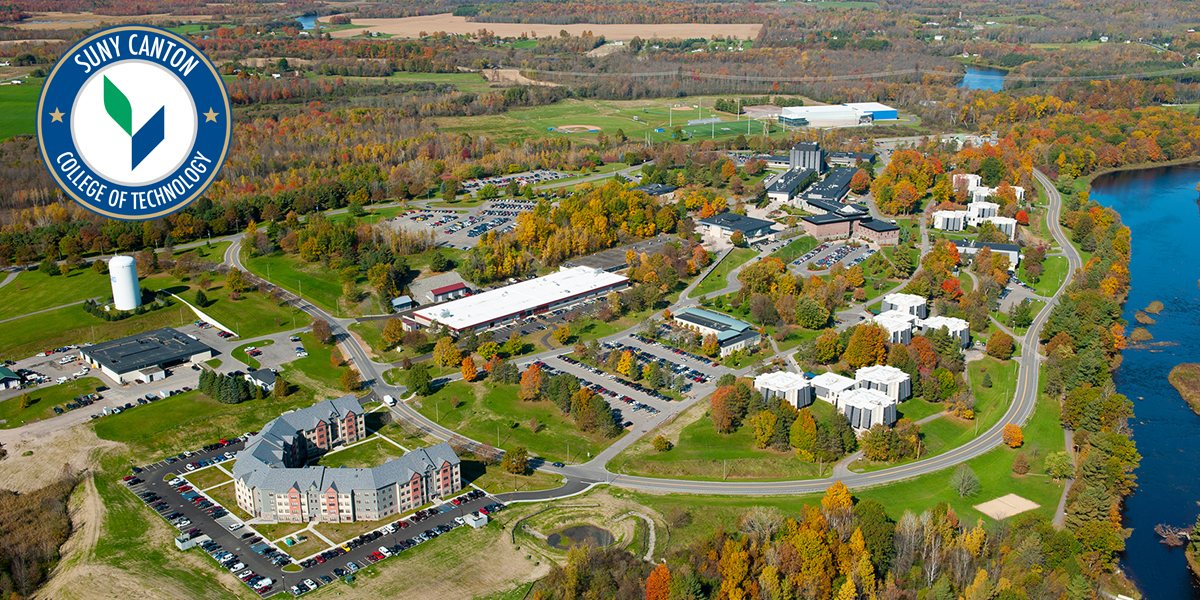
SUNY College of Technology at Canton campus

🇺🇸 USA · New York

SUNY College of Technology at Canton

  • Public
  • Rural
  • 4-year degree
Reported admit rate
92.2%Year unverified
Tuition per year
₹12,74,845Out-of-state
Students
2,741Undergraduates
Students per teacher
18Student to faculty

Admissions planning estimate

92.2% baseline · Low data confidence

Sensitivity range: 57.2%–99%. This is a modelling range, not a statistical confidence interval or a personal admission probability.

Stored headline rate, year/definition not independently confirmed in this refresh. Retained as a prior rather than applying an unsupported inflation multiplier. Historical IPEDS 2023 comparator: 96.34%; different cohorts are not mixed.

Reviewed 2026-10-01. Recommendations also use your grades, intended course, eligibility and available entrance cutoffs.

All / All Rounds: 96.3% (3,313/3,439; 2023). Fall 2023 first-time first-year applicants; historical, not 2026. Official source

Reported admit rate

92 in 100 applications received an offer in this reported cohort. Year unverified. This is not your personal chance.

From application to first day

Applied 3,707
Offered a place 3,416
Enrolled 539

15.8% of students offered a place chose to enrol (the yield).

Scores of enrolled test-submitters

The middle 50% of enrolled students who submitted scores. Test-optional selection can affect these bands.

SAT composite960-1130
4001600

What a year costs

₹28,84,839 published cost of attendance, per year
  • Tuition₹12,74,845
  • Housing₹14,87,883
  • Books & supplies₹1,22,112
Sticker price ₹28,84,839
After aid (average) ₹14,34,154

Tuition by who is paying

In-state ₹8,21,153
Out-of-state ₹12,74,845

Average aid awarded: ₹8,49,051 a year.

Outcomes and support

69.5%
Retention
38.5%
Graduation
78%
Get financial aid
4%
From out of state

One teacher for every 18 students

A typical ratio for a strong university.

Who studies here

As reported by the college; shares may not add up to 100.

White 65.2%
Hispanic 11.9%
African American 10.3%
Multiracial 3.5%
Unknown 2.7%
Asian 2.6%
Native American 1.9%
Pacific Islander 0.1%

4 programmes

  • Certificate
  • Associate
  • Bachelor's
  • Transfer

Programmes

ProgrammeLevel
Agricultural Business and Managementbachelor
Agriculture/Veterinary Preparatory Programsbachelor
Business Administration, Management and Operationsbachelor
Business, Management, Marketing, and Related Support Services, Otherbachelor
Civil Engineering Technologies/Techniciansbachelor
Clinical, Counseling and Applied Psychologybachelor
Computer and Information Sciences, Generalbachelor
Computer Programmingbachelor
Computer/Information Technology Administration and Managementbachelor
Criminal Justice and Correctionsbachelor
Criminologybachelor
Dental Support Services and Allied Professionsbachelor
Design and Applied Artsbachelor
Electrical/Electronic Engineering Technologies/Techniciansbachelor
Engineering Technologies/Technicians, Generalbachelor
Engineering-Related Fieldsbachelor
Finance and Financial Management Servicesbachelor
Funeral Service and Mortuary Sciencebachelor
Health and Medical Administrative Servicesbachelor
Homeland Securitybachelor
Human Development, Family Studies, and Related Servicesbachelor
Legal Support Servicesbachelor
Mechanical Engineering Related Technologies/Techniciansbachelor
Mechatronics, Robotics, and Automation Engineeringbachelor
Natural Resources and Conservation, Otherbachelor
Non-Professional Legal Studiesbachelor
Public Healthbachelor
Radio, Television, and Digital Communicationbachelor
Registered Nursing, Nursing Administration, Nursing Research and Clinical Nursingbachelor
Security Science and Technologybachelor
Sports, Kinesiology, and Physical Education/Fitnessbachelor
Veterinary Administrative Servicesbachelor
Veterinary/Animal Health Technologies/Techniciansbachelor

Every detail

Admissions & Requirements

Acceptance Rate92.15%
Total Applicants3707
Admitted Applicants3416
Enrolled Applicants539
Application Fee₹4,697
Fee Waiver AvailableNo
SAT/ACT RequirementConsidered if submitted
GPA RequirementRequired
Class Rank RequirementNot required
Recommendations RequiredConsidered if submitted
AP Credit AwardedYes
AP Placement AwardedYes

Deadlines

Test Scores

SAT Composite 25th %960
SAT Composite 75th %1130

Cost & Financial Aid

In-State Tuition₹8,21,153
Out-of-State Tuition₹12,74,845
Average Housing Cost₹14,87,883
Books & Supplies₹1,22,112
Average Net Price₹14,34,154
Students Receiving Aid78%
Average Aid Awarded₹8,49,051
Out-of-State Students4%

Student Body Diversity

African American10.25%
Asian2.55%
Hispanic11.86%
White65.16%
Multiracial3.54%
Native American1.86%
Pacific Islander0.11%
International2.01%
Unknown Race2.66%

Academics & Rankings

School TypePublic
School SettingRural
Years4
Graduation Rate38.45%
Retention Rate69.49%
Student/Faculty Ratio18:1
Total Undergraduates2741

Contact

Street Address34 Cornell Dr
ZIP Code13617
Phone(315) 386-7123
Apply (official portal)https://www.commonapp.org/